Super Funds Analysis (APRA) -Updated June 2023
APRA released their latest super funds data on August 22, 2023 to the June quarter. We have delved into the details and added some of our adviser data and population figures from the ABS. The analysis below aims to highlight some of the important movements that may affect advice business.
Note: The SMSF data via the ATO for the same period is yet to be published by the ATO. Therefore, we have relied on the data from APRA in relation to SMSF data in this report. Once we have that data, we may update this report and update our specific SMSF Dashboards.
Key Points from the APRA Data, including the Dashboards (e.g. D1 = dashboard 1) that you can view for more detail. The dashboards, which are dynamic, are held in the Members Lounge under ‘Super Funds APRA Level Review’. If you are not a member, join today.
D1 - Opportunity for advisers - The total super assets divided by the number of advisers comes in at $220 mil per adviser, compared to $211 last quarter. Back at the start of 2019 it was only $88 mil per adviser. Comfortably more than doubling in 4 1/2 years. The same chart also shows that there are 1,706 people per adviser. Back in 2019 it was only 900.
D1 - Total assets by population - The level of super per head of population, has moved up slightly this quarter to $128,746, up from $126,811. The peak was in Dec 2021 at $129,261.
D2 - SMSFs as a share of total super assets is at 25.6% - Has hovered between 25 and 27% since the records became available in 2017. However, dipping slightly over the last 4 quarters
D2 - Industry Funds are out in front at 33.9% of total assets - after being in fourth position in 2017 at 22%. Most of their gains have come in recent years as they swallowed up some Public Funds and gained market share from Retail Funds post the Royal Commission. Meanwhile, retail funds are flattening at around 20% for the last few quarters.
D2 - Net asset movement over 12 months (rounded to nearest $1 BIL). Industry funds have grown by $139 BIL or 13.61%, Retail up by $50 BIL or 7.86% and SMSFs up by $32 BIL or 3.79%.
D3 - Five year returns favour Industry funds at 5.8% - This is a small drop from 6.2% over the last quarter. The peak was 10.3% back in June 2017. Retail funds are at 4.5% and Public funds at 5.4%. Retail funds have lagged Industry funds by approx 1.3 to 2% over most quarters.
D4 - Net Assets and Entities - The number of entities remained the same across the major funds. However, the big difference is the gain per entity. For Industry funds, the average entity now holds $52.7 Billion, up by $1.8 BIL over the quarter and by just over $10 BIL over 12 months. Retail funds are at an average of $9.5 BIL per entity, the same as last quarter and only up by $0.1 BIL over the year. The significant difference in assets to entities may well be leading to greater opportunities to leverage scale through investment options and reduce costs (See later) for Industry funds.
D5 - Net Contributions - For the quarter, Industry Funds were up by $23.81 BIL, Retail funds were again negative at (-$2.47 BIL). This chart, which has a few options to view running totals and flows in percentages, clearly shows how Industry funds have pulled ahead of all other funds in recent years.
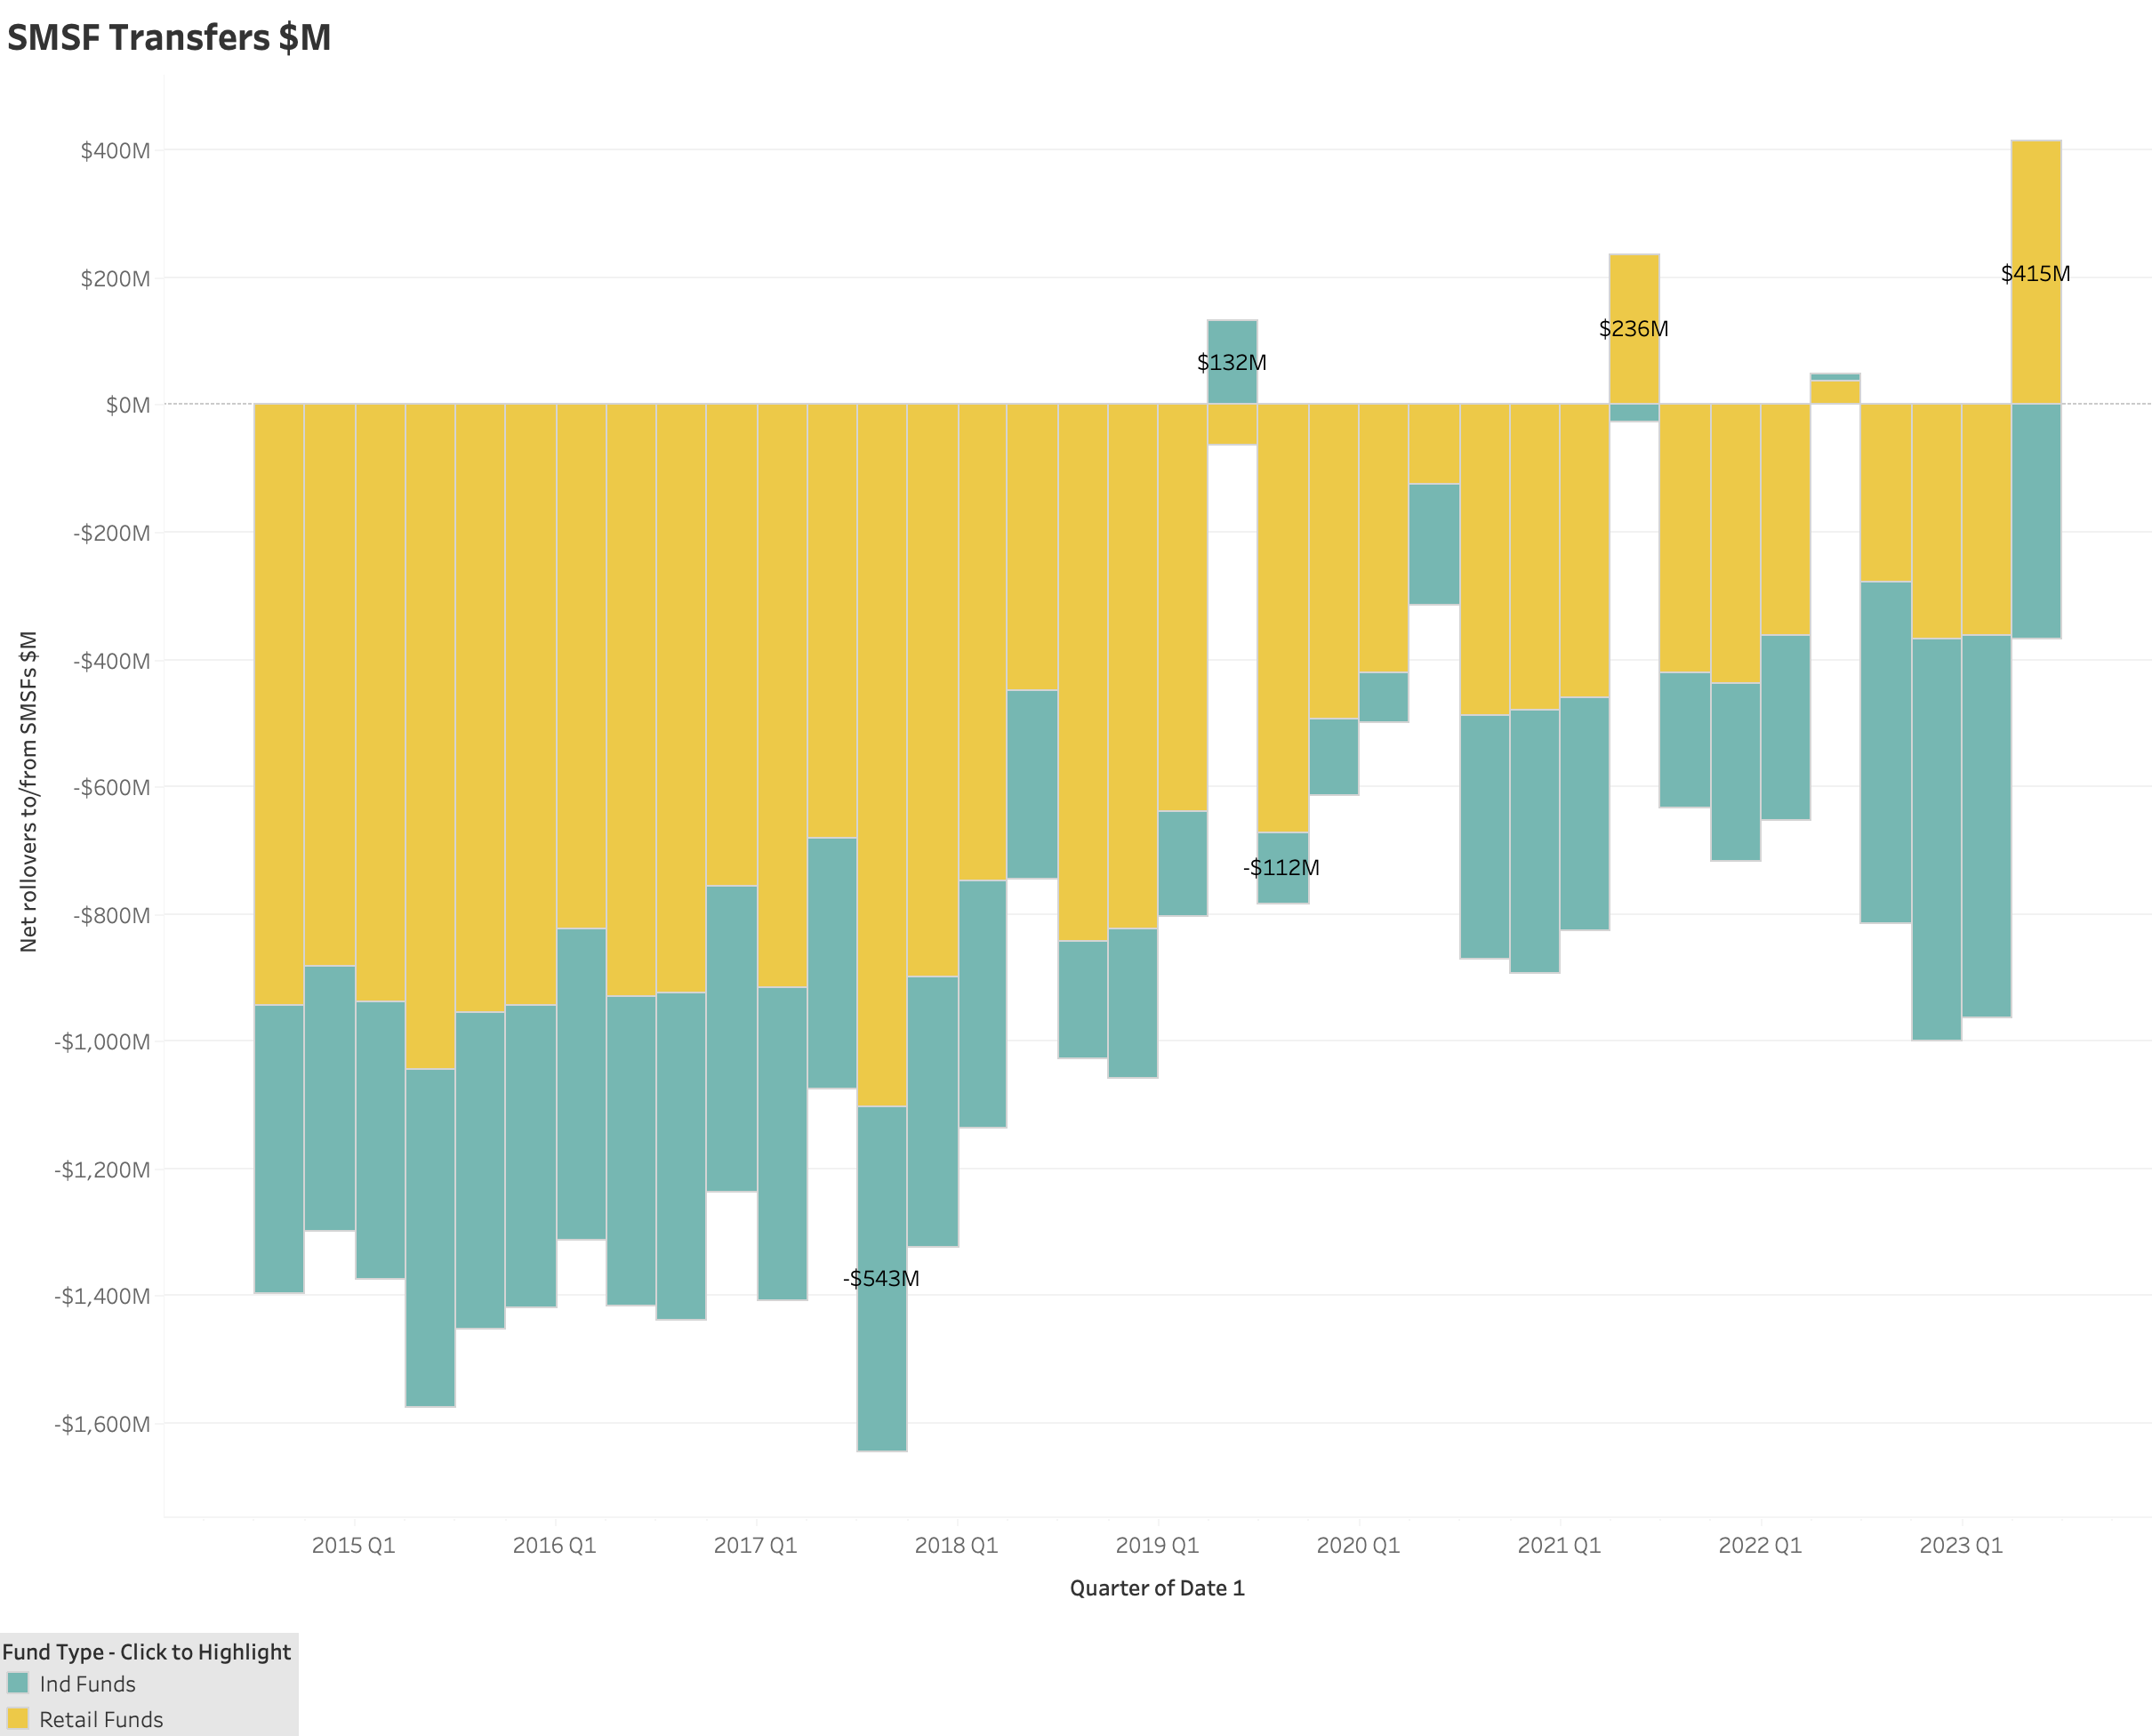
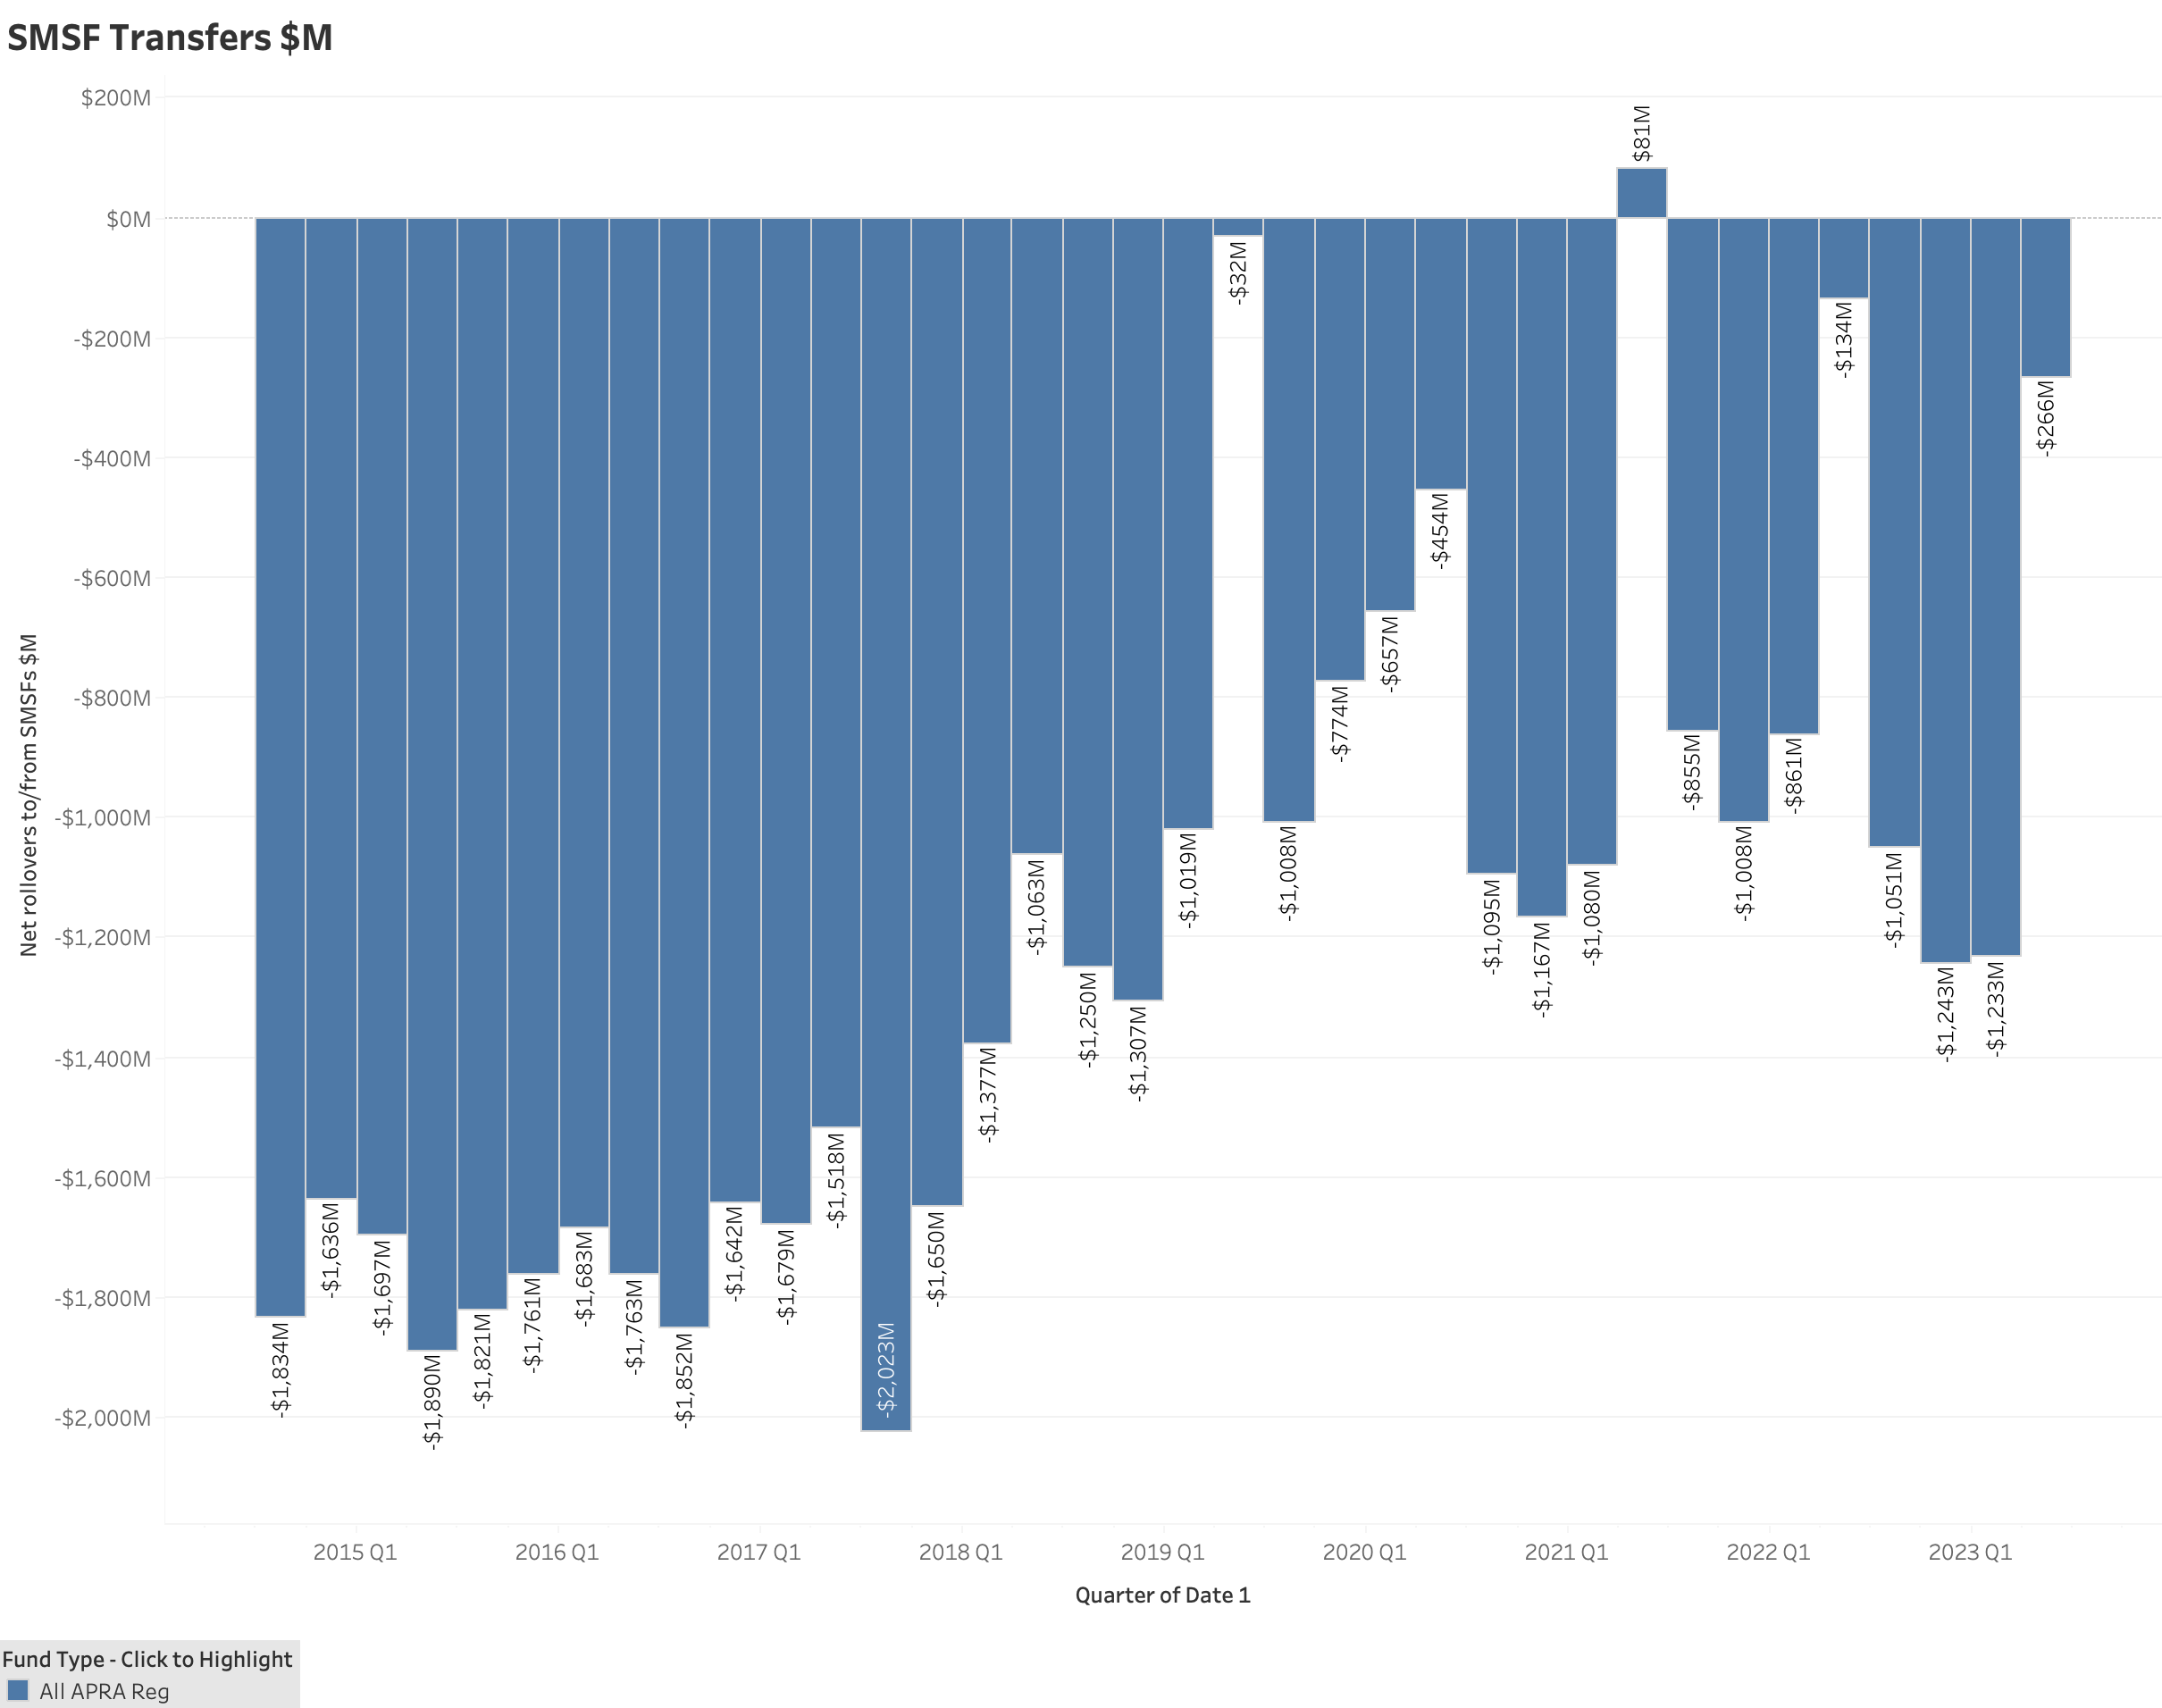
D7 - Net Transfers and SMSFs Specific Transfers - Retail funds were in the red as a total at (-$6.42 BIL) while Industry funds are up by $8.08 BIL. What was very interesting the quarter was the net movement between funds and SMSFs. (See charts below). Retail funds were net beneficiaries of SMSF transfers at $415 MIL while Industry funds had a net outflow of (-$367 MIL). Overall, SMSF funds did benefit when measured against all APRA Funds by $266 MIL.
D9 - Fees as a % of total assets continue to fall - On a quarterly level, Industry Funds are at 0.114% and Retail Funds at 0.172%. On a rolling 12 months, Industry Funds are at 0.483% and Retail at 0.711%. Back in 2012, both were very similar at 0.84% for Industry Funds and 0.85% for Retail. Scale may well be the driver, as highlighted in D4 Net Assets and Entities above.
D9 - Investment - Assets Allocations - While recent media has focused on the proportion of assets held in unlisted Property for Industry funds, the exposure has dropped, likely driven by reduced valuations. Industry funds now hold 5.9% of assets in unlisted property assets, compared to 6.9% for June 2022. Unlisted infrastructure is a different story. Industry funds currently hold 11.4% of all assets in Infrastructure assets, with 5.5% unlisted in Australia and 4.5% unlisted overseas, in total 10% of all assets are held in unlisted infrastructure assets. This is a little up over the 12 months from 9.6%.
In summary, Industry funds are growing rapidly at the expense of Retail funds. SMSFs have remained stable over most years, albeit dipping over the past 12 months.
Retail and Industry Funds - Net Transfers to SMSF Funds per Quarter
All APRA Funds Net Transfers to SMSF Funds


