

Superannuation Data Analysis By Fund Type To March 31, 2026
Revised Jun 23, 2026 as Investment Allocations were released by APRA on June 22. Updated commentary re Investment Allocations are shown below. Note: SMSF stats also updated - impact is minor.
APRA has released updated superannuation data by fund type to March 2026. As with previous quarters, we have combined the dataset with our financial adviser numbers, ABS population data and ATO SMSF statistics. Below are some of the highlights and dashboard numbers relating to the data — accessible to Members only.
The standout theme this quarter is the continued and accelerating — bleed of money out of Industry Funds and into SMSFs. That structural shift played out against an unusual backdrop: the March quarter was the first negative investment quarter in a year, so total assets edged lower across every APRA fund type even as the underlying flows kept moving in a positive direction.
Below, our commentary includes the Dashboards that members can access to view more details. See Super By Fund Type
Market Context — A Rare Down Quarter (D2, D3)
Investment markets went backwards in the March quarter. Quarterly returns were negative across the board: Industry Funds around –1.5%, Corporate –1.9%, Public –2.0% and Retail around –2.6%. It was the weakest single quarter since the June 2022 quarter (Q2 2022) — the few mildly negative quarters in between (such as Q1 2025) were all far shallower.
As a result, net assets fell for every APRA fund type: Industry Funds –$17bn (to $1,569bn), Retail –$21bn (to $860bn), Public –$10bn (to $765bn) and Corporate –$1bn (to $35bn). All APRA-regulated funds combined fell $50bn, from $3,278bn to $3,228bn.
SMSFs were the exception, holding flat at $1,022bn - See also Transfers to SMSFs below.
Total superannuation (APRA funds plus SMSFs) eased to around $4.25 trillion, from $4.30 trillion at December.
Adviser Opportunity (D1)
Calculated by dividing total superannuation assets by the number of advisers.
Fell for the first time in several quarters, down $5 million to $281 million per adviser (from $286 million at December), as the market-driven dip in assets coincided with a small lift in adviser numbers to 15,119 (from 15,054).
Despite the dip, the long-run trend is firmly up: since the peak in adviser numbers at end-2018, the opportunity has more than tripled, from $88 million to $281 million per adviser.
On a per-person basis, total super per Australian eased to $154,850 (from $156,876), again reflecting the soft quarter for markets rather than any change in the structural trajectory.
Market Share & Fund Flows (D2)
Industry Funds continue to dominate overall market share at 36.9%.
SMSFs are the second-largest sector at 24.0%, holding steady despite being the primary beneficiaries of fund transfers (see below). Their share is held in check by a higher proportion of members moving into retirement phase.
Retail Funds sit at 20.2% and Public Funds at 18.0%, with Corporate Funds now a residual 0.8%.
Transfers to SMSFs (D7) - See chart below
This is the story of the quarter. Net outflows from Industry Funds to SMSFs continue to accelerate.
The rolling annual net transfer from Industry Funds to SMSFs increased again, from –$7.21 billion (year to December 2025) to –$7.76 billion (year to March 2026). For context, that figure was around –$0.88 billion only a few years ago (year to Q1 2022).
The single March quarter saw Industry Funds shed –$1.91 billion to SMSFs, easing slightly from the back-to-back record quarters of –$2.21 billion and –$2.17 billion that immediately preceded it.
This quarter loss of -$1.91 billion, while an improvement on the December quarter, it is much larger than the same period last year which was -$1.35 billion and for the same quarter in 2024 is was only -$0.94 billion.
Retail Funds also lose money to SMSFs, but on a smaller scale at –$0.64 billion in the quarter and –$2.50 billion on a rolling annual basis (up from –$2.23 billion at December).
Measured as a share of total contributions (rolling four-quarter average), net SMSF transfers now equate to about –7% of Industry Funds' contributions and about –4% of Retail Funds', both at or near their widest on record.
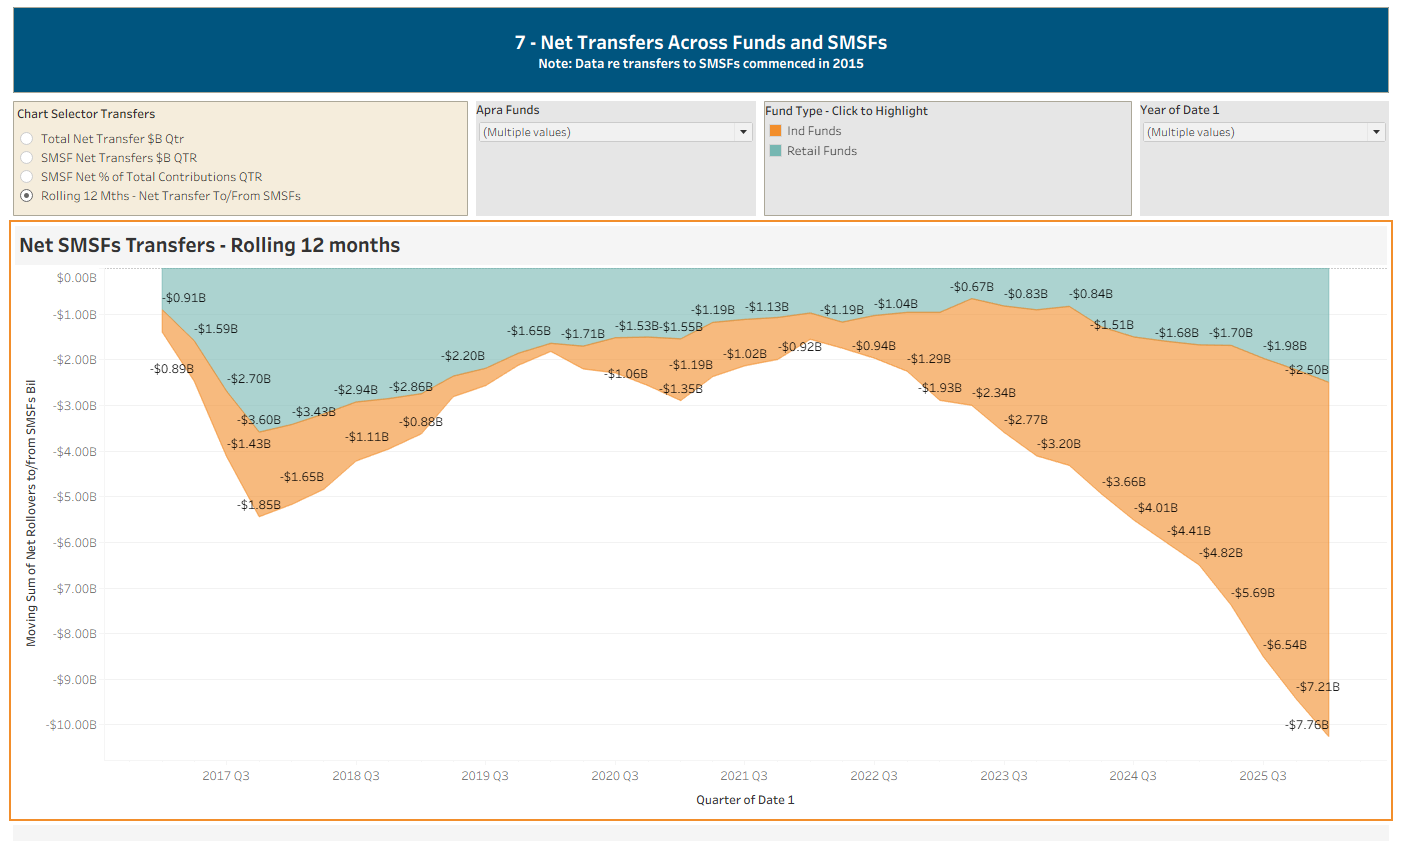
Chart highlights the net transfers from Industry and Retail Funds to and from SMSFs - The transfers from Industry Funds has increased steadily over recent times.
Total Net Transfers Inc SMSF Transfers, Rolling 12 Months (D7) - Total transferred between all fund types.
Once all transfers are included (SMSFs plus movements between APRA funds), the reversal in Industry Funds is stark. Industry Funds recorded their fourth consecutive quarter of negative total net transfers: –$3.77bn, –$4.43bn, –$4.13bn and –$3.47bn (March quarter).
On a rolling annual basis, Industry Funds' total net transfers swung to roughly –$15.8 billion for the year to March 2026, from –$5.6 billion for the year to December 2025. Much of that step-down is a base effect — a strongly positive March-2025 quarter (+$6.8bn) dropped out of the 12-month window — but the direction is unmistakable.
Retail Funds, by contrast, posted +$2.45 billion for the quarter and a clearly positive result on a rolling annual basis, reversing the historical pattern in which Industry Funds recorded positive net transfers and Retail Funds negative. Notably, Retail Funds are now winning transfers from other APRA funds even while losing a smaller amount to SMSFs. Our Fund-level analysis shows certain Retail platforms (e.g. HUB24) gaining significant inflows.
Net Contributions — Total Funds In Versus Total Funds Out (D5)
Industry Funds' rolling annual net contributions fell for a fourth straight quarter, to $50.72 billion (from $59.46 billion the prior quarter), continuing a clear downtrend from the $78.96 billion peak in early 2024.
Retail Funds have kept improving, with rolling annual net contributions edging up again to $23.68 billion.
The contribution gap between Industry and Retail Funds has therefore narrowed sharply — to about $27 billion, down from roughly $38 billion at December and more than $80 billion at the peak.
Much of this shift is also being driven by rising benefit payments (D6). Industry Funds paid $13.38 billion in benefits in the quarter, now roughly level with — and on a total basis above — Retail Funds at $11.97 billion; Retail still pays more in pension benefits ($5.14bn vs $4.29bn), but Industry's pension payments are climbing as its membership ages.
On a cumulative basis since 2021, Industry Funds have still gathered around +$326 billion of net flows, versus far smaller positives for Retail and Public and a net drain from Corporate.
Investment Returns (D3)
After a long run of strong results, the March quarter was negative for all fund types — the key reason assets fell this quarter.
On a rolling 12-month basis, returns have moderated to 7.8% (Industry), 7.0% (Public) and 6.7% (Corporate and Retail), down from the mid-8% range at December. Industry Funds remain narrowly ahead.
Five-year annualised returns have eased across the board. Example comparison:
Q4 2025: Industry 7.4% vs Retail 6.8%
Q1 2026: Industry 6.4% vs Retail 5.6%
Expenses (D10)
Industry Funds continue to report materially lower administration and operating costs as a percentage of assets than Retail Funds.
Industry Funds carry higher investment expenses, consistent with their greater use of direct and in-house investment management.
Retail Funds remain far more competitive on cost than they were several years ago.
Asset Allocation (D8) Note data now updated to March 2025
Industry Funds directly manage around 66% of assets; Retail Funds just under 12%.
Asset Allocation — Industry vs Retail (D9) — now updated to March 2026
APRA's investment allocation data now extends to 31 March 2026, so we can track how the four asset classes have shifted across three consecutive March quarters (2024, 2025 and 2026). The headline remains the same: Industry and Retail Funds are built differently, and the gap is holding firm rather than closing.
The listed-versus-unlisted divide is still the defining difference
Infrastructure is where the two sectors diverge most. Industry Funds hold around 10.9% of all assets in infrastructure at March 2026, versus just 4.2% for Retail, and almost all of Industry's exposure is unlisted (around 9.7% of assets, against just 1.7% for Retail). This is the structural feature that most clearly separates the two models.
Property tells a similar, smaller story. Industry Funds carry more unlisted property (around 5.0% of assets vs 1.5% for Retail), while Retail Funds lean toward listed property (3.9% vs 1.6%). Both sectors trimmed property modestly over the three years - Industry from 7.4% to 6.6%, Retail from 6.2% to 5.5%.
Unlisted equity follows the same pattern: Industry sits around 5.1% of assets, Retail just 1.9% and falling (down from 2.8% in 2024).
Where the three-year drift shows up
Equities rose for both, but Industry moved more, its core equity weight climbed 3.7 points, from 55.3% (March 2024) to 59.0% (March 2026), narrowing what was a clear Retail lead. Retail edged up just 0.6 points to 60.3%. Notably, almost all of Industry's lift came through unhedged international listed equity (up 4.2 points to 25.8%), suggesting a greater willingness to carry currency exposure.
Cash is the cleanest divergence of the three years. Industry Funds cut cash from 8.6% to 6.3%, while Retail Funds lifted cash slightly, from 9.0% to 9.4%. Retail Funds now hold meaningfully more cash than Industry.
Fixed income moved in opposite directions too: Industry trimmed from 19.5% to 18.3%, Retail nudged up from 18.9% to 19.4%. The two have essentially swapped places, with Retail now carrying the larger defensive bond weighting.
Industry Funds directly manage around 66% of assets; Retail Funds just under 12%.
Key allocation differences remain in Infrastructure (Industry ~10.6% vs Retail ~3.9%) and Property (Industry ~6.7% vs Retail ~5.8%), where Industry Funds maintain materially higher exposures.
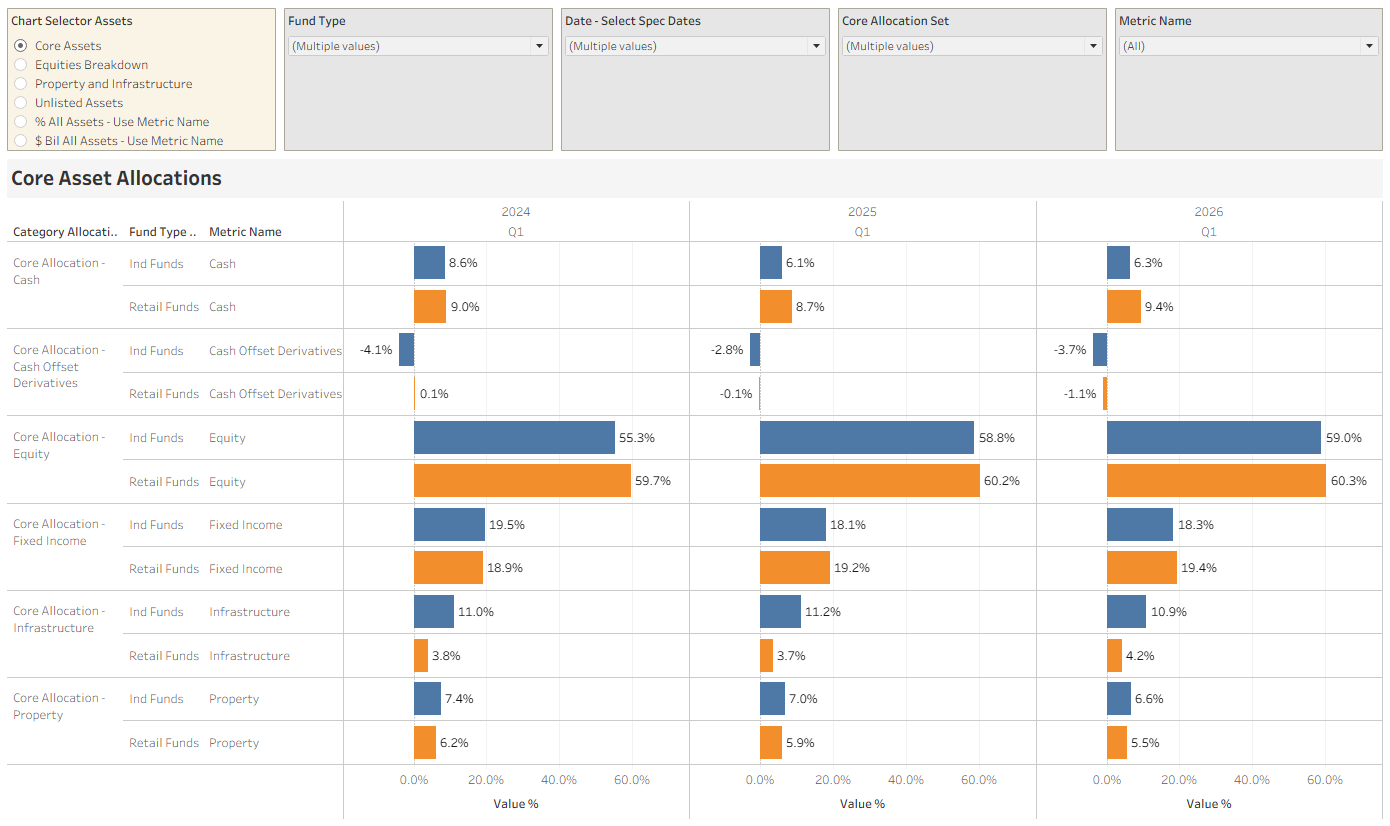
Core Assets Allocations By Q1 from 2024 to 2026. Comparing Industry and Retail Funds
The Takeaway
Strip out the market noise of a single soft quarter and the structural picture is unchanged and, if anything, sharpening. Industry Funds still dominate by assets and contributions, but they are now consistently losing money on a net-transfer basis, overwhelmingly to SMSFs while Retail Funds quietly rebuild.
The rolling annual drain from Industry Funds to SMSFs has climbed to –$7.76 billion, the contribution gap to Retail has more than halved in under a year to about $27 billion, and SMSFs absorbed the market hit without losing ground. The advice opportunity sitting behind these flows paused with the market this quarter at $281 million per adviser, but its direction is unchanged.
Members have access to the full set of dashboards highlighting the key movements in the data above, including detailed SMSF dashboards.
Source: APRA Quarterly Superannuation Statistics; ATO SMSF Statistics; ABS population data; Wealth Data financial adviser numbers. Figures use end-of-quarter net assets and may differ slightly from APRA's headline "Key Statistics" totals.