

Annual ‘Fund Level’ Superannuation Statistics
APRA released fund-level superannuation data in December 2025, mainly covering to June 2025. We have included gender and investment allocation data to September 2025. Expense data stops at June 2024.
Note Free Fund Level Superannuation Dashboard has been updated
New dashboards include:
Gender: by number of accounts and member benefits.
Tax status: member balances in taxed vs. untaxed phases.
Contribution drivers: detailed splits to show rollovers in/out and flows to SMSFs.
Filters let you compare by fund type (Retail vs Industry) and fund size.
We also added ATO SMSF data for context. Explore the 16 dashboards and create your own analysis.
Superannuation is concentrated among a few large funds.
Total member benefits: $3,917b (June 2024: $3,574b).
Total assets: $4,059b
SMSFs: $1,013b (25% market share).
Fund type shares (by member benefits):
Industry funds: 50% (excluding SMSF); seven industry funds hold 34% overall. AustralianSuper 13.35%, Australian Retirement Trust 11.49%. Industry funds hold 14.35 million accounts (of ~24 million). Average balance: $102,061. Median one-year return: 10.15%.
Retail funds: 21% market share of assets, 5.95 million accounts. Average balance: $140,306. Median one-year return: 9.4%.
Public sector: 15% market share across 10 funds, concentrated in two. Average balance: $236,428.
SMSFs: 25% share, average balance: $849,678.
Notes: 12 other industry funds hold only 5% of the market. Retail’s 21% is split: 19% in 11 funds, 2% across 35 smaller retail funds.
Member benefits and median balances held by females lower than males Dashboard 4 data to Sep 2025
Member benefits for females are generally between 69% (Corporate) to 91% (Retail)of balances held by males
Across some of the major funds (female v male)
AustralianSuper - $91,904 v $120,812
Australian Retirement Trust - $132,390 v $149,718
UniSuper $193,773 v $233,334
Colonial First State $176,337 v $185,021
HUB24 $271,840 v $274,424
Across Industry funds, females hold some 38% of member benefits while holding 43% of all accounts.
For Retail funds females hold 43% of member benefits and 4% of all accounts
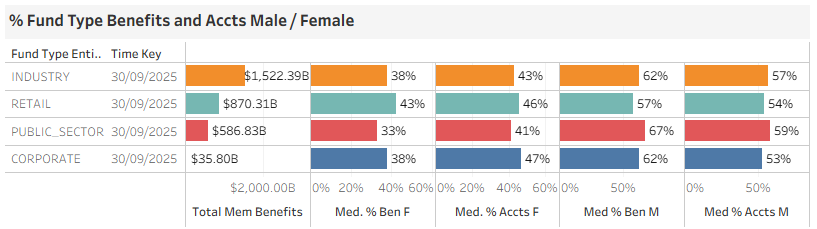
Highlights the proportion of member benefits and accounts by female and male
Retail Funds closing the investment returns gap - Dashboard 5
The median one year return for Industry Funds was 10.1% and 9.4% for Retail Funds.
For all funds with $20b or more, Retail funds did well, with Mercer Super Trust at 11.3% followed by two industry funds, Hostplus at 11% and Unisuper at 10.8%. Three retail funds come next with AMP Super Fund and Colonial both at 10.6% and Retirement Portfolio Service (Insignia) at 10.5%.
At the other end of the investment spectrum, 10 year median returns for Industry funds are 6.92% versus 5.48% for Retail Funds.
For funds with more than $20b of assets, Industry funds hold the top five spots with Hostplus in top position at 7.86% and Australian Super next at 7.5%. The best performing retail fund is AMP Super Fund in tenth spot with a return of 6.69%.
Net Contributions and Rollovers — Dashboards 9, 11 and 12
SFTs (Succession Fund Transfers) complicate net contribution figures. For 2025, funds show only positive SFTs for the year, likely due to reporting timing. Dashboards show numbers with SFTs included and removed.
Key points
Net flow (all flows in less all flows out) including SFTs (counted as rollovers): Industry $81.5b (vs $70b in 2024); Retail $23.6b (vs $31.2b in 2024).
Net flow excluding SFTs: Industry $39.7b (vs $45.1b in 2024); Retail $15.0b (vs $5.3b in 2024).
CareSuper had the largest net inflow at $23.9b, but $23.6b was an SFT
Excluding SFTs, AustralianSuper led at $13.0b, then HUB24 at $8.6b.
Looking at net rollovers only, excluding SFTs: Retail funds gained $10.1b; Industry funds lost $9.0b. The top seven gains were Retail; only UniSuper was a positive Industry fund ($1.1b).
After removing SFTs and rollovers to SMSFs, HUB24 gained $6.8b and Netwealth $4.3b.
Net positive rollovers to SMSFs were small: HUB24 $0.64b, Asgard $0.16b.
Biggest SMSF losses were AustralianSuper (-$1.44b) and Australian Retirement Trust (-$1.40b).
By fund type, net loss to SMSFs: Industry funds $5.63b; Retail funds $1.68b.
Our quarterly “Super Fund By Fund Type” report (12 months to Sep 30, 2025) shows Industry-to-SMSF losses rose to $6.54b.
Members Benefits and Accounts Held in Taxed or Tax Free Phase Dashboard 12
Industry Funds have 97.2% of their accounts in Taxed phase and 91% of members benefits (median used)
Retail funds have 70.4% of accounts in taxed phase and only 58% of member benefits (median used)
Some of the large funds include:
AustralianSuper at 96.6% of accounts and 85% of member benefits.
REST at 99.1% and 95%
ART at 95.6% and 84%
Colonial First State 74.6% and 60%
Wealth Personal Super (AMP) 60.7% and 49%
Asset Allocations Updated to Sep 2025 - Dashboard 13
Overall, asset allocations follow a similar path with Industry Funds generally carrying a greater share of Infrastructure assets compered to retail funds. Data that stands out for the funds more than $20b include:
AMP Super Fund holds 70.7% in equities with Netwealth second highest at 64.4%
Unisuper holds 11.2% i Property followed by Telstra at 10.6%. Highest Retail fund is Mercer at 7.8%
CBUS holds 12.3% in Infrastructure followed by Unisuper at 12.0%. Highest Retail fund is Colonial First State at 6.9%
Eight funds held more than 10% in cash with Unisuper and Telstra both at 14.3%. Asgard at 13.9% and Hub24 at 13.4%