

SMSF Statistics To June 2026 - Solid Growth Despite Increased Benefit Payments
ATO June 2026 SMSF Data Release – Key Insights
The ATO has released its June 2026 SMSF statistics, closing out the financial year, and the sector has again pushed to fresh records. Both the number of funds and the number of members reached new highs, net assets moved comfortably past $1.06 trillion, and new-fund establishments recorded their strongest-ever June quarter.
All member dashboards (14 in total) have now been updated - See SMSF Member Stats Here .... Free Dashboard - Limited Dashboards Now Updated
Free limited range of dashboards will be updated later in the month.
Below is a summary of the key data points, with references to the relevant dashboard numbers.
Total SMSFs and Members – New Records (D2)
As at June 2026:
- 680,301 SMSFs
- 1,246,552 members
This compares with March 2026:
- 670,113 SMSFs
- 1,229,032 members
And with June 2025 (the prior June quarter):
- 633,292 SMSFs
- 1,161,024 members
Over the past year the sector has added 47,009 funds (+7.4%) and 85,528 members (+7.4%). See chart below going back to 2020.
Both funds and members have now grown every quarter, and the pace has stepped up again over the past year. The sector added just over 10,000 funds in the June quarter alone and has cleared the 1.24 million member mark, with total funds now well past 680,000.
Note: the ATO routinely revises prior quarters with each release as late lodgements and wind-ups are processed. All comparison figures in this post are drawn from the latest (June 2026) dataset, so some prior-quarter numbers differ slightly from those published at the time — the March 2026 figures above, for example, have been revised since last quarter's post.
A Record June Quarter for Establishments (D3)
The June quarter is historically the weakest quarter of the year for net growth. That is because the ATO processes a large batch of fund wind-ups in the June quarter each year, which has pushed net establishments deeply negative in almost every prior June.
On two measures, June 2026 broke the mould:
- New establishments (gross): 12,264 — the strongest June quarter on record, up around 9% on the 11,267 new funds established in the June 2025 quarter, and comfortably ahead of June 2024 (8,863) and June 2023 (7,002).
- Net establishments (new less wind-ups): 10,188 — which, taken at face value, is by far the strongest June quarter ever recorded.
For context, here is how June quarters normally look on a net basis:
- Q2 2026: 10,188
- Q2 2025: 27
- Q2 2024: –3,279
- Q2 2023: –5,264
- Q2 2022: –6,590
- Q2 2021: –6,881
An important caveat on the net figure. Wind-ups in this release total just 2,076 for the quarter, well below the 11,000–14,000 that the June quarter has typically recorded once the annual wind-up batch is processed. As we always flag, there is a lag in closure data, and June is the quarter most affected. It is therefore very likely that the June 2026 net figure will be revised down in coming releases as those wind-ups come through. The more reliable signals this quarter are the record gross establishments and the record total fund and member counts — both of which are firmly intact.
Net Assets and Averages (D4)
Total SMSF net assets have reached:
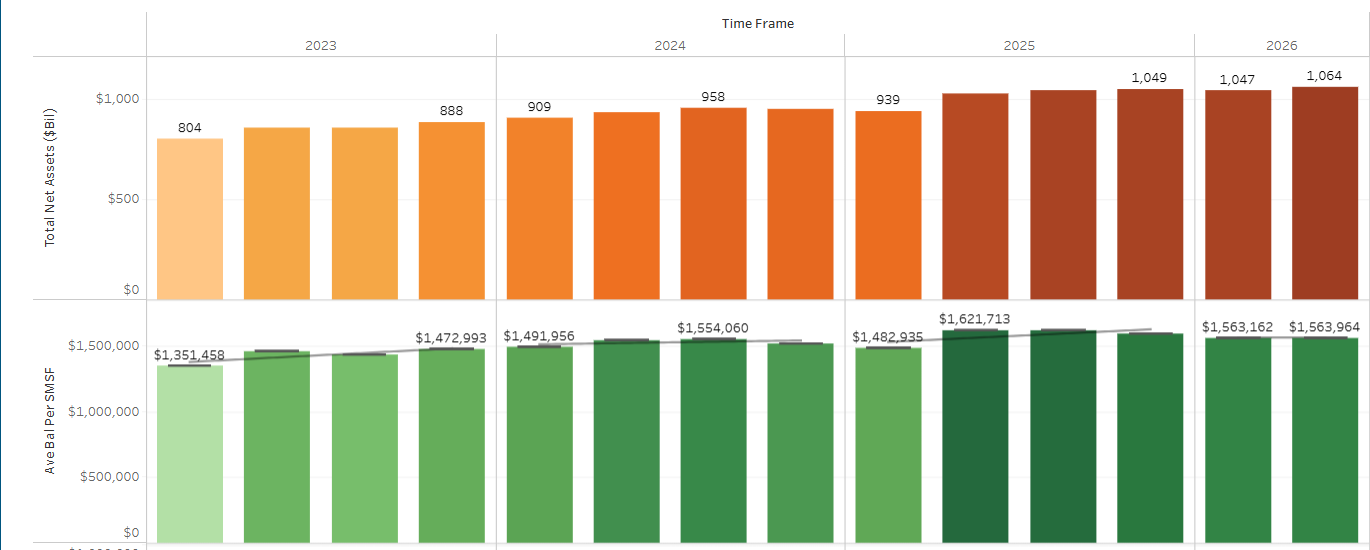
- $1,063.97 billion (approx. $1.06 trillion), up from $1,047.50 billion at March 2026 and $1,027.02 billion a year earlier (June 2025) — a gain of around $37 billion over the year.
Average balances have stabilised after several quarters of softening, edging slightly higher over the June quarter:
- Average assets per SMSF: $1,563,964 (up marginally from $1,563,162 at March 2026, though still below the $1,621,713 of June 2025)
- Average assets per member: $853,527 (up from $852,293 at March 2026, and below the $884,579 of June 2025)
The year-on-year dip in averages reflects the same dynamic we have noted through the year: funds and members are being added faster than assets are accumulating, because new funds start with lower balances, member numbers are climbing quickly, and a large cohort of members is now in retirement phase and drawing down.
***Note: The benefits paid out of SMFSs reached $66.7 bil for financial year 2024-25, data updated in this release. In 2023/24 fin year benefit payments were $55.0 billion.
Overall net flows (before fees) have typically been negative, For 2024-25 year the amount is -$24.6 bil and in 2023-24 it was -$20.4 bil. This reflects larger SMSFs maturing
Financial Adviser Opportunity Continues to Expand (D1)
The structural opportunity for advisers keeps widening as fund numbers climb while adviser numbers continue to drift lower — the total number of advisers has now slipped below 15,000, to 14,882.
As at 30 June 2026, there were 45.7 SMSFs per financial adviser*, compared with:
- 44.3 at March 2026
- 40.4 at Q4 2024
- 20.4 at Q4 2018
The asset opportunity per adviser has tracked the same way:
- $71 million per adviser (Q2 2026)
- $69 million (Q1 2026)
- $61 million (Q4 2024)
- $22 million (Q4 2018)
This metric does not imply that all SMSFs use advisers. Rather, it illustrates the relative scale of opportunity per adviser as adviser numbers have declined and SMSF numbers have grown.
The SMSF opportunity for advisers has now more than doubled since 2018, and with advisers falling below 15,000 while funds push past 680,000, the trend shows no sign of slowing.
The Money Behind the Growth – Transfers Into SMSFs
The growth story does not sit in isolation. Money continues to flow into the SMSF sector from the wider superannuation system, and the ATO's own flow data confirms the scale of it.
- SMSFs recorded net inward rollovers (transfers in less transfers out) of around $12.2 billion in 2024–25, up sharply from $9.2 billion the year before and roughly triple the $3.9 billion of 2020–21. Money is moving into SMSFs from other funds at an accelerating rate.
- Member and employer contributions into SMSFs also continue to rise, reaching close to $30 billion combined in 2024–25.
This aligns with our companion analysis of APRA data by fund type (Superannuation Analysis by Fund Type, which has shown a steady, building net transfer out of Industry Funds and into SMSFs. Together, the two data sets tell the same story: more Australians are choosing to take direct control of their retirement savings, and that decision is increasingly being funded by rollovers out of the large APRA funds.
Member Demographics (D10, D11)
The demographic profile of the sector remains tilted toward established members, while new entrants skew younger:
- Across total membership, the 75–84 age group holds the largest share of all SMSF members (around 13.8%), closely followed by the 35–44 group (around 12.9%), which remains the main engine of new fund establishments.
- A striking 38% of all SMSF members are now aged 65 or over, which underpins the retirement-phase drawdown activity noted above.
- Membership remains weighted toward males (52.7%) versus females (47.3%), with males making up a higher proportion across most age and income bands.
This combination — younger entrants establishing funds while a large older cohort moves into drawdown — is exactly what we would expect in a maturing sector that is still attracting a fresh wave of new trustees.
Additional Dashboard Insights
The dashboards include further breakdowns covering:
- Assets and asset ranges
- State-by-state representation
- Cost data
- Additional demographics
- Time-series comparisons
Users can filter by time frame and segment to explore the data in more detail.
SMSF growth continues despite higher benefits payments being paid out
Join The Members Lounge Today
First Month Now Only $39.00 Selecting 'YEARLY' cost is only $950