

Superannuation Data Analysis By Fund Type To June 30, 2026
Note: Data now update to June 2026 for Asset Allocations - See below
APRA has released updated superannuation data by fund type to June 2026. As with previous quarters, we have combined the dataset with our financial adviser numbers, ABS population data and ATO SMSF statistics. Below are some of the highlights and dashboard numbers relating to the data — accessible to Members only.
The standout theme this quarter is a sharp market-driven rebound as total superannuation assets jumped to around $4.49 trillion after March's rare down quarter. The underlying structural story stays largely intact: Industry Funds continue to bleed money to SMSFs, though at a slower pace than the recent run of accelerating losses.
This quarter also marks a reporting change at APRA: Corporate Funds* are no longer reported as a separate category, (from this quarter onwards - history remains in place) and the merger of Telstra Super, the last remaining major corporate fund into Aware Super (a Public Sector fund) shows up as a large one-off transfer. We've explained that below so it isn't confused with the ongoing SMSF trend.
Below, our commentary includes the Dashboards that members can access to view more details. See Super By Fund Type
Market Context — A Strong Rebound (D2, D3)
Investment markets bounced back strongly in the June quarter after March's rare loss. Quarterly returns were positive across the board: Public Funds around +6.1%, Retail +6.0%, Industry Funds +5.8% and the All-APRA average +5.9%. It was one of the strongest quarters since APRA's records began in 2004 — only four quarters have ever been stronger.
Net assets rose across every fund type: Retail Funds +$60.7bn (to $921.2bn), Public Funds +$57.9bn (to $822.4bn) and Industry Funds +$115.9bn (to $1,684.7bn) — though around $35bn of Industry's increase reflects Corporate Funds' remaining entities being folded into the Industry Fund category this quarter, not organic growth (see note below). All APRA-regulated funds combined rose $200.1bn, from $3,228bn to $3,428bn.
SMSFs posted a more modest gain this quarter, up $16.5bn to $1,064.0bn.
Total superannuation (APRA funds plus SMSFs) rebounded to around $4.49 trillion, from $4.28 trillion at March — recovering all of the prior quarter's dip and then some.
*A reporting change on Corporate Funds: from this quarter, APRA no longer reports Corporate Funds as a separate category — funds previously classified as Corporate are now folded into Industry Funds. This was triggered by Telstra Super, the last remaining major corporate fund, merging into Aware Super (a Public Sector fund). That merger explains both the jump in Industry Funds' opening balance this quarter (Corporate's ~$35bn base was briefly picked up under Industry before the merger) and the large one-off transfer out of Industry and into Public Sector Funds noted below.
Adviser Opportunity (D1)
Calculated by dividing total superannuation assets by the number of advisers.
Jumped by around $19.1 million to $301.9 million per adviser (from $282.7 million at March), one of the largest single-quarter increases we've recorded, driven by the combination of the market rebound and a fall in adviser numbers.
Adviser numbers fell to 14,882 (from 15,122), reversing last quarter's small uptick and landing at their lowest level in at least two years. Note: End of June figures for advisers usually dips at June 30 as many advisers retire and many decide to change licensees with an end date of June 30 in their old licensee and a start date of July 1 in their new licensee.
On a per-person basis, total super per Australian rebounded to $160,676 (from $153,362), reflecting the strong quarter for markets.
Market Share & Fund Flows (D2)
Industry Funds' market share edged up to 37.1% (from 36.9%).
SMSFs continue to gain ground, up to 24.4% (from 24.0%) — again the second-largest sector, still constrained somewhat by members moving into retirement phase.
Retail Funds sit at 20.3% and Public Funds at 18.1%, both broadly steady. Corporate Funds no longer appear as a distinct category following APRA's reporting change and the Telstra Super merger noted above.
Transfers to SMSFs (D7) - See chart below
The underlying trend continues, but the pace of deterioration has slowed.
The rolling annual net transfer from Industry Funds to SMSFs eased further into negative territory, from –$7.76 billion (year to March 2026) to –$7.87 billion (year to June 2026) — still a record low, but the quarter-on-quarter worsening (+$0.11bn) was far smaller than the +$0.55bn deterioration seen in the previous quarter.
The single June quarter saw Industry Funds shed –$1.58 billion to SMSFs, an improvement on March's –$1.91 billion and continuing to ease from the back-to-back record quarters of –$2.21bn and –$2.17bn recorded in late 2025. However, the quarter net outflow of $1.58 bn was greater than the previous June 2025 quarter of $1.48 bn
Retail Funds recorded a net inflow from SMSFs this quarter — +$0.21 billion — the first positive quarter for Retail Funds since June 2023. On a rolling annual basis this pulled Retail's SMSF drain back to –$2.17 billion (from –$2.50 billion at March).
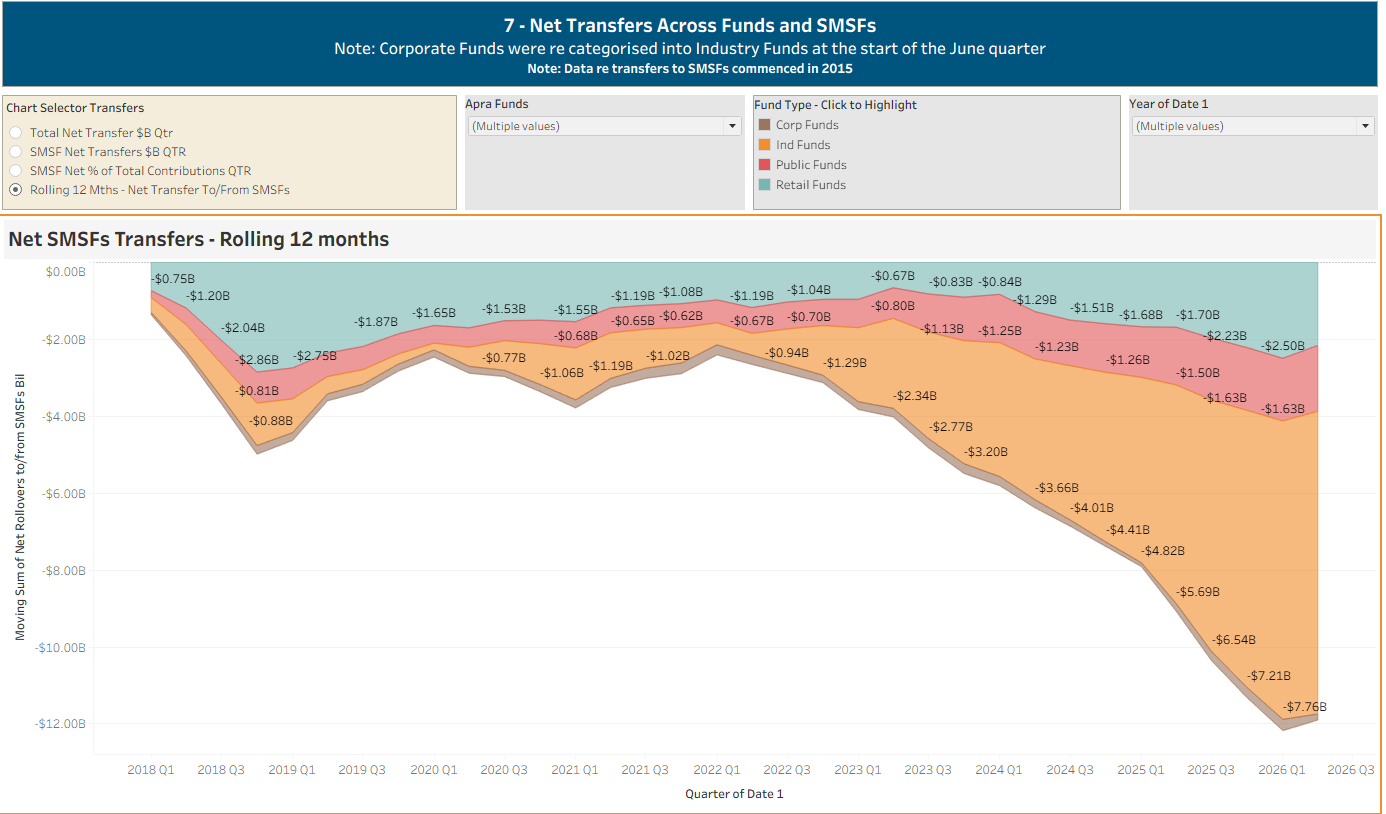
Chart highlights the net transfers from Industry, Public, Corporate and Retail Funds to and from SMSFs - The transfers from Industry Funds has increased steadily over recent times.
The Telstra Super / Aware Super Merger — Total Net Transfers Inc SMSF Transfers, Rolling 12 Months (D7)
Once all transfers are included (SMSFs plus movements between APRA funds), this quarter's numbers carry a large one-off: the merger of Telstra Super into Aware Super. Industry Funds recorded a net outward transfer of –$32.7 billion for the quarter (versus –$3.5bn in March), while Public Sector Funds recorded a net inward transfer of +$26.3 billion (versus –$1.5bn in March) — this is the merger, not a change in underlying flow preference.
Because of this, Industry Funds' rolling annual total net transfers swung to around –$44.7 billion for the year to June 2026 (from –$15.8 billion at March). We'd treat that figure as a one-off rather than a signal, and expect it to fall out of the rolling window over the next three quarters.
Retail Funds' rolling annual total net transfers held broadly steady at around +$13.3 billion (from +$13.7bn), unaffected by the merger and a cleaner read of the underlying trend.
For Retail Funds, they have now gone nine straight quarters of positive net transfers against all funds. This is quite extraordinary given it had previously only had three positive quarters over the previous 25.
Net Contributions — Total Funds In Versus Total Funds Out (D5)
This measure also captures net transfers, so it too carries the Telstra Super / Aware Super merger. Industry Funds' rolling annual net contribution flow fell sharply to $26.0 billion (from $50.7 billion) and Public Funds' rose sharply to $28.6 billion (from $1.9 billion) — both moves are the merger flowing through, not a genuine shift in contribution or benefit-payment trends. We'd expect this to normalise over coming quarters as the event drops out of the rolling window.
Retail Funds' rolling annual net contribution flow held steady at $24.0 billion (from $23.7bn), unaffected by the merger and a cleaner read this quarter.
On benefit payments (D6): Industry Funds paid $16.12 billion in benefits in the quarter ($10.96bn in lump sums, $5.16bn in pensions); Retail Funds paid $15.17 billion ($8.55bn lump sums, $6.61bn pensions). Retail still pays more in pension benefits on a single-quarter basis, consistent with recent quarters.
Investment Returns (D3)
After March's rare loss, this was one of the strongest quarters on record for all fund types.
On a rolling 12-month basis, returns lifted to 9.0% (Industry), 8.5% (Public) and 7.8% (Retail), up from the 7–8% range at March. Industry Funds remain ahead on this measure.
Five-year annualised returns improved across the board as the strong June quarter entered the window: Industry 6.7% (from 6.4%), Public 6.6% (from 6.3%) and Retail 5.8% (from 5.6%).
Expenses (D10)
Industry Funds continue to report materially lower administration and operating costs as a share of assets than Retail Funds — this quarter's ratios (0.045% vs 0.152% of assets, on a quarterly basis) are consistent with recent trends.
Industry Funds continue to carry higher investment expenses as a share of assets (0.077% vs 0.037% for Retail), consistent with their greater use of direct and in-house investment management.
Note - Asset Allocations to be updated upon data release from APRA
Asset Allocation (D8) Note data updated to June 2026
APRA's investment allocation data has now been updated to 30 June 2026, and this quarter we've extended the comparison to include Public Sector Funds alongside Industry and Retail Funds. To avoid seasonal noise, the comparisons below use the same quarter (Q2/June) across three years — 2024, 2025 and 2026 .
Direct investment management
Industry Funds remain the most self-managed of the three, directly running around 66.4% of assets at June 2026, little changed over the two years (a tight 65.4%–66.8% range).
Public Sector Funds are the standout mover: direct investment management has climbed from 54.5% (June 2024) to 57.4% (June 2026), including a sharp jump from 55.3% just one quarter earlier at March 2026. Public Funds are increasingly building in-house capability, closing part of the gap to Industry Funds. Note: Mergers may have increased the ratios.
Retail Funds remain the outlier, directly managing only around 11.3% of assets, essentially flat over the period, reflecting continued reliance on external investment managers.
Core allocations — equities keep climbing, fixed income keeps falling
Equities: all three lifted their weighting, but Industry moved the most, up 3.4 points to 60.2% (from 56.8% at June 2024), closing in on Retail. Retail remains the highest equity allocator at 61.3% (up 1.6 points), while Public Funds are the most conservative on this measure at 57.8% (up 1.5 points).
Fixed income: all three trimmed exposure. Public Funds cut the most, down 2.9 points to 17.6%; Industry cut 2.2 points to 18.3%; Retail was the most stable, down just 0.3 points to 18.8% — Retail now holds the largest fixed income buffer of the three.
Cash: Industry cut cash the most, from 6.8% to 5.9%. Public Funds held theirs broadly steady (6.8% to 6.4%). Retail Funds kept the largest cash buffer of the three, essentially unchanged at 9.4%, a consistently more liquid, conservative posture.
Infrastructure: still the sharpest three-way divide. Industry Funds hold around 10.3% of assets in infrastructure, more than double Public Funds (8.2%) and over 2.5 times Retail (4.0%). Industry's weighting has eased slightly over two years while Retail's has edged up; Public sits in between and is essentially unchanged.
Property: the three have converged noticeably. Industry (6.6%), Public (7.0%) and Retail (5.6%) now sit within 1.4 points of each other, versus a wider spread two years ago.
Equities under the hood
The clearest new differentiator is currency hedging on international equities. Public Funds run materially more hedged exposure (12.2% of assets, up from 10.2%) than either Industry (7.0%) or Retail (6.1%) — both of which lean heavily toward unhedged international equity instead (25.9% and 26.8% respectively, both up more than 3 points over two years). Public Funds' unhedged international equity allocation, by contrast, was little changed at 20.1%.
Retail Funds still carry the largest Australian-listed equity weighting (25.8%), though it has eased slightly from 26.9%; Public Funds' Australian-listed weighting rose the most (18.9% to 19.9%).
Unlisted equity remains a genuinely Industry/Public phenomenon — Public leads at 5.7% (though down from 6.5%), Industry at 5.0% (up from 4.8%), against just 2.2% for Retail (down from 2.8%).
Property and infrastructure under the hood
Unlisted infrastructure best captures the structural gap between models: Industry (9.2%) and Public (7.7%) both run large unlisted infrastructure books, versus just 1.6% for Retail Funds, essentially unchanged for Retail over the full two years.
Unlisted property tells a similar story, though Public Funds have quietly caught up to Industry here, Public rose from 4.9% to 5.1% while Industry eased from 5.3% to 4.8%, putting them almost level. Retail's unlisted property exposure remains minimal at 1.5%.
Listed property is where Retail stands apart, holding 4.0% of assets (down from 4.4%) versus just 1.8% (Industry) and 1.9% (Public). Retail's property exposure is overwhelmingly listed (REIT-style), while Industry and Public favour unlisted, direct holdings.
What it means: the long-running Industry/Retail divide, direct versus external management, unlisted versus listed alternatives — still holds, and if anything has widened on infrastructure. The more interesting move over the last two years is Public Sector Funds converging toward the Industry model on direct investment management and unlisted property, while carving out their own distinct approach to currency hedging that neither Industry nor Retail shares.
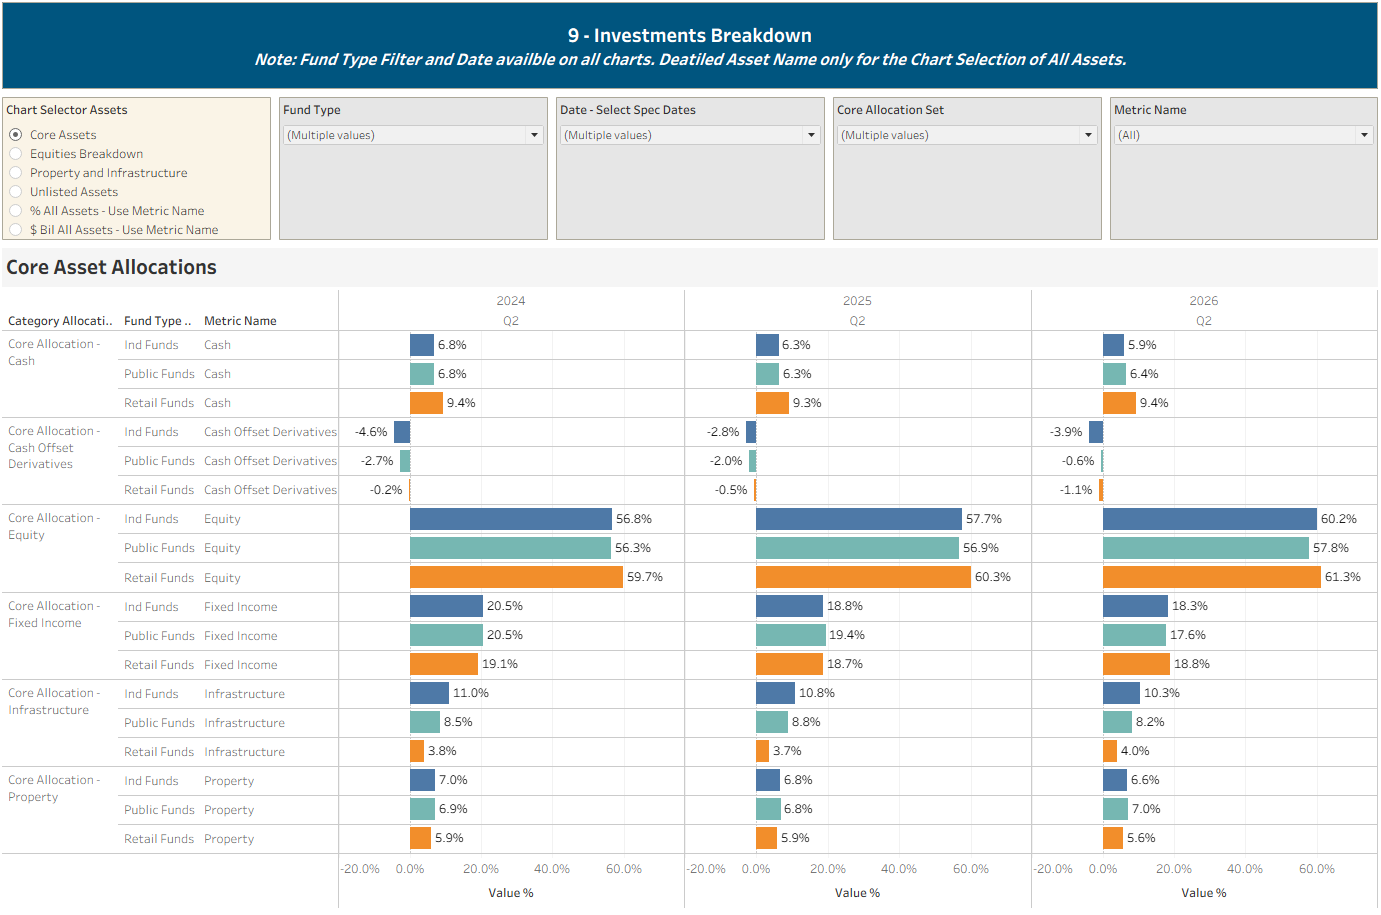
Core Assets Allocations By Q2 from 2024 to 2026. Comparing Industry, Public and Retail Funds
Source: APRA Quarterly Superannuation Statistics; ATO SMSF Statistics; ABS population data; Wealth Data financial adviser numbers. Figures use end-of-quarter net assets and may differ slightly from APRA's headline "Key Statistics" totals.