

SMSF Statistics To March 2026 - Records Keep Tumbling
ATO March 2026 SMSF Data Release – Key Insights
The ATO has released its March 2026 SMSF statistics (today June 16, 2026, and the headline story is clear: the SMSF sector is growing faster. Both the number of funds and the number of members pushed to fresh records this quarter and the March quarter itself was the strongest opening quarter the sector has ever recorded.
All member dashboards (14 in total) have now been updated - See SMSF Stats Here
Free limited range of dashboards will be updated later in the month.
Below is a summary of the key data points, with references to the relevant dashboard numbers.
Total SMSFs and Members – New Records (D2)
As at March 2026:
- 672,805 SMSFs
- 1,239,977 members
This compares with December 2025:
- 661,776 SMSFs
- 1,220,976 members
And with March 2025 (the prior March quarter):
- 633,920 SMSFs
- 1,169,025 members
Over the past year the sector has added 38,885 funds (+6.1%) and 70,952 members (+6.1%). See chart below going back to 2020.
Both funds and members have now grown every quarter and the rate of growth has clearly stepped up since 2022. The sector added just over 11,000 funds in the March quarter alone matching the net-establishment figure below and has comfortably cleared the 1.24 million member mark.
Note: the ATO routinely revises prior quarters with each release as late lodgements and wind-ups are processed. All comparison figures in this post are drawn from the latest (March 2026) dataset, so some prior-quarter numbers differ slightly from those published at the time.
A Record March Quarter for Net Establishments (D3)
The March quarter is historically a solid, but not spectacular, quarter for new funds. Not this year.
Net establishments (new funds less wind-ups) for the March 2026 quarter reached 11,029, the strongest March quarter on record, and by a wide margin. Comparing like-for-like March quarters shows just how steep the trajectory has become:
- Q1 2026: 11,029
- Q1 2025: 8,722
- Q1 2024: 6,280
- Q1 2023: 4,720
- Q1 2022: 4,320
In other words, this March quarter delivered roughly 26% more net growth than the same quarter a year ago and more than 2.5 times the net growth recorded in the March 2022 quarter.
For context within the broader trend, the December 2025 quarter set a Q4 record at 11,646 net establishments and the all-time single-quarter record remains Q3 2025 at 14,612. The last several quarters have consistently run well above the 10,000 net mark, a level the sector had never previously sustained.
As always, it is worth noting that there is typically a lag in closure data, as wind-ups can take several quarters to be fully reflected in the statistics.
Net Assets and Averages (D4)
Total SMSF net assets have reached:
- $1,017.73 billion (approx. $1.02 trillion), essentially flat on the December 2025 quarter ($1,017.40 billion) and up from $950.78 billion a year earlier (Q1 2025).
While total assets held their ground, average balances have continued to soften:
- Average assets per SMSF: $1,512,667 (down from $1,537,381 at December 2025, and $1,499,847 in the March 2025 quarter)
- Average assets per member: $820,765 (down from $833,269 at December 2025, and $813,313 in the March 2025 quarter)
So while average balances eased over the quarter, they remain modestly higher than the same point a year ago. The softening is recent rather than a longer-run decline.
The pattern here is consistent with what we flagged last quarter. Establishments are running at record levels, but assets are not growing at the same pace, because:
- New funds typically begin with lower balances
- Member numbers are rising quickly
- A high proportion of funds are now in retirement phase and members drawing down on their funds.
That SMSF net assets held essentially flat this quarter is itself notable — see the Industry Fund transfer commentary below, and our recent Superannuation Analysis by Fund Type post. The March quarter was the first negative investment quarter in a year, with every APRA fund type losing assets, yet SMSFs were the exception that held flat — supported by the steady inflow of transfers.
Financial Adviser Opportunity Continues to Expand (D1)
The structural opportunity for advisers keeps widening as fund numbers climb and adviser numbers stay broadly flat.
As at 31 March 2026, there were 44.5 SMSFs per financial adviser*, compared with:
- 44.1 in Q4 2025
- 40.4 in Q4 2024
- 20.4 in Q4 2018
The asset opportunity per adviser has tracked the same way:
- $67 million per adviser (Q1 2026)
- $68 million (Q4 2025)
- $62 million (Q4 2024)
- $22 million (Q4 2018)
This metric does not imply that all SMSFs use advisers. Rather, it illustrates the relative scale of opportunity per adviser as adviser numbers have declined and SMSF numbers have grown.
The SMSF opportunity for advisers has now more than doubled since 2018 and the latest quarter shows no sign of that trend slowing.
The Money Behind the Growth – Transfers from Industry Funds
The SMSF growth story does not sit in isolation. Our companion analysis of APRA data by fund type (Superannuation Analysis by Fund Type to March 2026) shows where a meaningful share of this money is coming from: it is increasingly being transferred out of Industry Funds and into SMSFs.
- The rolling annual net transfer from Industry Funds to SMSFs has climbed to –$7.76 billion (year to March 2026), up from –$7.21 billion at December 2025. A few years ago (year to Q1 2022) that figure was only around –$0.88 billion.
- The single March 2026 quarter saw Industry Funds shed a net –$1.91 billion to SMSFs. While that eases off the back-to-back records of –$2.21 billion and –$2.17 billion in the prior two quarters, it is well above the –$1.35 billion recorded in the same quarter last year and the –$0.94 billion in the March 2024 quarter.
- Retail Funds also lose money to SMSFs, on a smaller scale — –$0.64 billion in the quarter and –$2.50 billion on a rolling annual basis.
This is the engine room behind much of the new-establishment activity. The data clearly shows that more Australians are choosing to take direct control of their retirement savings.
Member Demographics (D10, D11)
The demographic profile of the sector remains tilted toward established, higher-earning members, while new entrants skew younger:
- New funds established this quarter are concentrated in the 35–44 age group, the single largest band for new establishments.
- Across total membership, the 75–84 age group holds the highest share of all SMSF individuals, and a significant proportion of funds have at least one member aged 65 or over — contributing to the drawdown and retirement-phase activity noted above.
- Membership remains weighted toward males (approximately 53%) versus females (approximately 47%), with males making up a higher proportion of both total and new members.
This combination of younger entrants establishing funds while an older cohort moves into drawdown.
Additional Dashboard Insights
The dashboards include further breakdowns covering:
- Assets and asset ranges
- State-by-state representation
- Cost data
- Additional demographics
- Time-series comparisons
Users can filter by time frame and segment to explore the data in more detail.
To access all 14 dashboards — become a member today.
Access All The Data Now For Just $39.00 for the first month.
- Monthly: $95.00 every month
- Yearly: $950.00 every year (first month only $39.00; selecting 'Yearly' the cost is only $950)
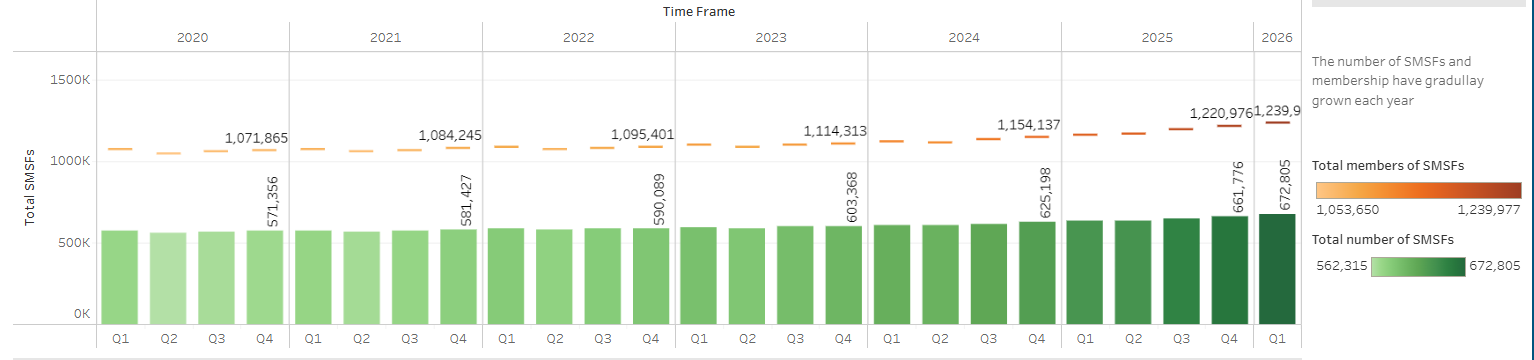
SMSF growth continues with over 110,000 member growth since 2020
Join The Members Lounge Today
First Month Now Only $39.00 Selecting 'YEARLY' cost is only $950