

Super By Fund Type To December 2024 - Retail Funds Maintain Momentum.
APRA recently published its latest superannuation data by fund type, covering the period up to December 31, 2024. We combined this with financial adviser information, population stats from ABS, and recent SMSF data from ATO.
This analysis reveals trends that may affect advisory firms, licensees, and wealth management companies. Member interactive dashboards have been updated for customised charts. Note: APRA has not updated asset allocations since September 2024.
Note: Full Set of Dashboards Available To Members - Join Here First month is only $39.00.
Key Findings (With Dashboard Numbers Referenced):
The main finding is that Retail Funds have maintained momentum. Not just this quarter, but over several and may have just about turned the corner after a torrid time post the Royal Commission.
Key Highlights
Growth This Quarter (D2 - select Chart Table $ and % Growth) - Net assets for all APRA funds (excludes SMSFs) grew by $67 billion, a 2.29% increase. Industry funds rose by $42 Bil, or 3.03% and Retail funds by $17 Bil or 2.14%. SMSFs decreased by $4 Bil, or (-0.40%).
Investment returns (D3 - select charts and dates) - The ‘Quarterly Totals Table’ shows that over the last ten quarters (Q3 2022 to Q4 2024), Retail funds have a total return of 24.0%, while Industry funds have a return of 22.2%.
The Rolling 12 Months table - see chart below (also from Dashboard 3), Retail funds has a rolling 12 month return of 11.2% to Dec 2024, Industry Funds at 10.5%. Retail funds have outdone Industry funds since December 2022.
Over five years, Industry funds still show stronger performance and are at 6.3% to Dec 2024 and 5.6% for Retail Funds. Back in Dec 2022 the difference was much greater, with Industry funds at 5.4% and Retail at 3.9%.
Note: Our analysis at the Individual Super Fund level clearly showed that major Retail funds with better returns than their counterparts. Read The Blog Post Here.
Net Transfers To SMSF Funds (D7) - SMSF funds generally drag funds from all other fund types. Over recent times, there has been a significant upturn in the assets being transferred from Industry funds. As the chart below highlights, the transfers from Industry funds is much larger than other fund types, whereas it was reasonably proportional in 2022.
Net Flows Dashboard (D5) - Industry funds still dominate net flows. However, It’s peak rolling 12 month net flow was in quarter 1, 2024 at $78.96 Bil. For this last quarter, it has dropped to $63.41 Bil. Retail funds back in quarter 1, 2024 was a negative (-$5.69 Bil). For this quarter it is a positive $13.02 Bil. The Industry funds are seeing significant increases in payments as Pension compared to just a few years ago. See dashboard 6 - Benefit Payments.
Adviser Opportunity ( Dashboard 1) - As the number of advisers has steadied, the opportunity in terms of super fund assets per adviser has also steadied. There total assets for APRA and SMSF funds, when divided by the number of advisers as of Dec 2024, shows a $256 Mil per adviser opportunity, this is slightly up from $252 Mil last quarter. Back in Dec 2018, it was only $88 Mil.
There are 10 dashboards of data highlighting key move net of the main data points associated with Superannuation Funds. We have also updated our SMSF dashboards which provide significant detail to the SMSF sector.
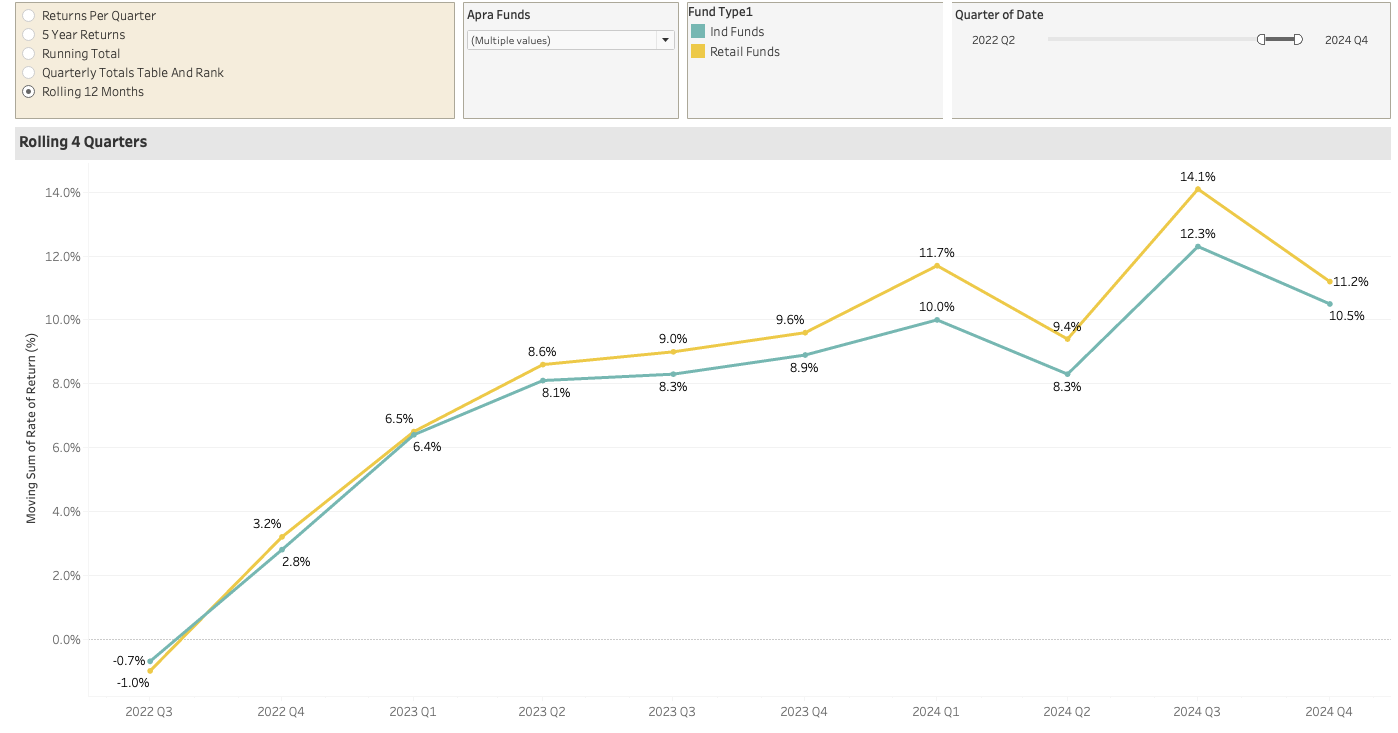
Rolling 12-Month returns since 2022 Q3 - Retail and Industry funds selected.
You may also wish to see our detailed analysis of SMSF Funds, which also includes an overlay of Advisers