

Superannuation Data By Fund Type To December 2025
APRA has recently released updated superannuation data by fund type to December 2025. We have combined the dataset with our financial adviser numbers, ABS population data, and ATO SMSF statistics. Below as some of the highlights and dashboard numbers relating to the data - accessible to Members only - Dashboards Link - Super By Fund Type
Adviser Opportunity (D1) - See also Chart Below
Calculated by dividing total superannuation assets by the number of advisers.
Increased by $10 million in the latest quarter (from $276 million to $286 million per adviser).
Since the peak in adviser numbers at end-2018, the opportunity has risen more than threefold (from $88 million to $286 million).
Growth this quarter reflects rising super assets and a sharp decline in adviser numbers during the most recent Dec quarter.
Market Share & Fund Flows (D2)
Industry Funds continue to dominate overall market share at 36%
Retail Funds have gained some ground after big losses in 2018/19 and running at 20.5%
SMSFs are steady albeit losing some ground, this is despite being the primary beneficiaries of fund transfers, largely from Industry Funds (see more below). Losing market share by assets as a higher proportion of members are in retirement phase.
Transfers to SMSFs (D7)
Net outflows from Industry Funds to SMSFs have accelerated significantly.
Rolling annual net transfer from Industry Funds to SMSFs increased from approximately –$0.88 billion (Q1 2022) to over –$7.2 billion (Q4 2025).
Total Net Transfers Inc SMSF Transfers, Rolling 12 Months (D7)
Industry Funds: over –$5.5 billion (net outflow).
Retail Funds: +$1.3 billion (net inflow).
This reverses historical trends where Industry Funds typically recorded positive net transfers and Retail Funds negative.
Fund-level analysis to June 2025 shows certain Retail Funds (e.g. HUB24) gaining significant inflows.
Net Contributions - Total funds in versus total funds out (D5)
Industry Funds have recorded three consecutive quarters of declining net contributions.
Retail Funds have improved net contributions each quarter since Q1 2024.
The contribution gap between Retail and Industry Funds has narrowed substantially (from over $80 billion to just over $38 billion)
Note - Much of this is data is also being driven by an increasing amount of benefits being paid out (D6)
Investment Returns (D3)
Returns remain strong across all fund types.
Retail Funds have narrowed the performance gap with Industry Funds.
Example comparison for Five year Returns:
Q4 2021: Industry 8.7% vs Retail 7.0%
Q4 2025: Industry 7.4% vs Retail 6.8%
Expenses (D10)
Industry Funds continue to report lower administration and operating costs as a percentage of assets.
Retail Funds have stabilised and are more competitive compared with several years ago.
Asset Allocation (D8)
Industry Funds directly manage over 66% of assets.
Retail Funds directly manage just under 12%.
Key allocation differences are in Infrastructure and Property, where Industry Funds maintain higher exposures.
Note: Full Set of Dashboards Available To Members - Join Here First month is only $39.00.
Members have access to 10 dashboards of data highlighting key movement of the main data points associated with Superannuation Funds. We have also updated our SMSF dashboards which provide significant detail to the SMSF sector.
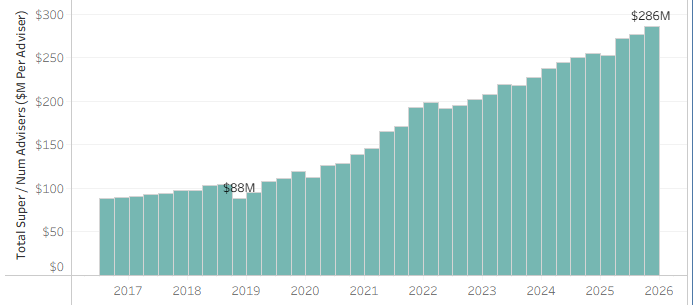
. Total Superannuation Assets Divided By Number of Advisers.
You may also wish to see our detailed analysis of SMSF Funds, which also includes an overlay of Advisers