

Super By Fund Type To June 2025 - Solid Quarter For Retail Funds.
APRA recently published its latest superannuation data by fund type, covering the period up to June 30, 2025. We combined this with financial adviser information, population stats from ABS, and SMSF data from ATO.
The Retail Funds performed very well with competitive investment returns and a very strong quarter for net flows (net contributions). While the June quarter is traditionally good for super funds, Industry Funds dipped and was well below its net contributions for June 2024.
This analysis reveals trends that may affect advisory firms, licensees, and wealth management companies. Member interactive dashboards have been updated for customised charts.
Notes: Re Asset Allocations - APRA released asset allocation data in early July, and we updated our dashboards on July 14, 2025, June data currently not available. Net SMSF assets for June quarter is best estimate using data from APRA. ATO detailed SMSF data yet to be released.
Note: Full Set of Dashboards Available To Members - Join Here First month is only $39.00.
Key Highlights
Growth This Quarter (D2 - Select Chart Table $ and % Growth) - Net assets (for APRA Funds with $50 Mil or more in assets) Jumped from $2,973 Bil to $3,123 Bil. Over 12 months, net APRA assets are up by $307 Bil.
Investment returns (D3 - select charts and dates) - The ‘Quarterly Totals Table’ shows that over the last quarter, Retail and Industry Funds both generated returns of 4.9% each. Over a rolling 12 month period, Industry Funds are at 10% and Retail Funds at 9.8%.
Over five years, Industry Funds top the returns at 8.3% p.a. followed by Public Funds at 7.8% and Retail at 7.6%.
Net Transfers To SMSF Funds (D7) - Net transfers to SMSFs from Industry Funds are now running at well over $1 Billion a quarter. The rolling 12 months is at (-$5,690 Mil) or (-$5.69 Bil). Back at Q2, 2022, the rolling 12 months net transfer was at (- $878 Mil) or (-$0.878 Bil). In the space of three years the net transfers have increased more than six times in value for Industry Funds.
Note: Retail Funds had a ‘positive’ net flow from SMSF Funds at $176 Mil. The rolling 12 month total for Retail Funds is at (-$1,684 Mil) or ($1.684 Bil).
Net Contributions Dashboard (D5) Chart Shown Below - Industry funds still dominate net contribution flows with $16.40 Bil this quarter, but was well down on the June 2024 quarter which was $21.07 Bil. However, Retail Funds bounced to $10.36 Bil well above June 2024 which was $6.29 Bil.
Adviser Opportunity ( Dashboard 1) - As the number of advisers has steadied, the opportunity in terms of super fund assets per adviser has also steadied. There total assets for APRA and SMSF funds, when divided by the number of advisers as of June 2025 is $272 Mil per adviser, up from $254 Mil in March 2025. Back in Dec 2018, it was only $88 Mil.
Investment Allocation - (Updated during July 2025) - Industry Funds have progressively allocated more to equities. For example, in 2023 Q1 they had 51.5% in equities and now at 58.7% for Q1 2025.
Members have access to 10 dashboards of data highlighting key move net of the main data points associated with Superannuation Funds. We have also updated our SMSF dashboards which provide significant detail to the SMSF sector.
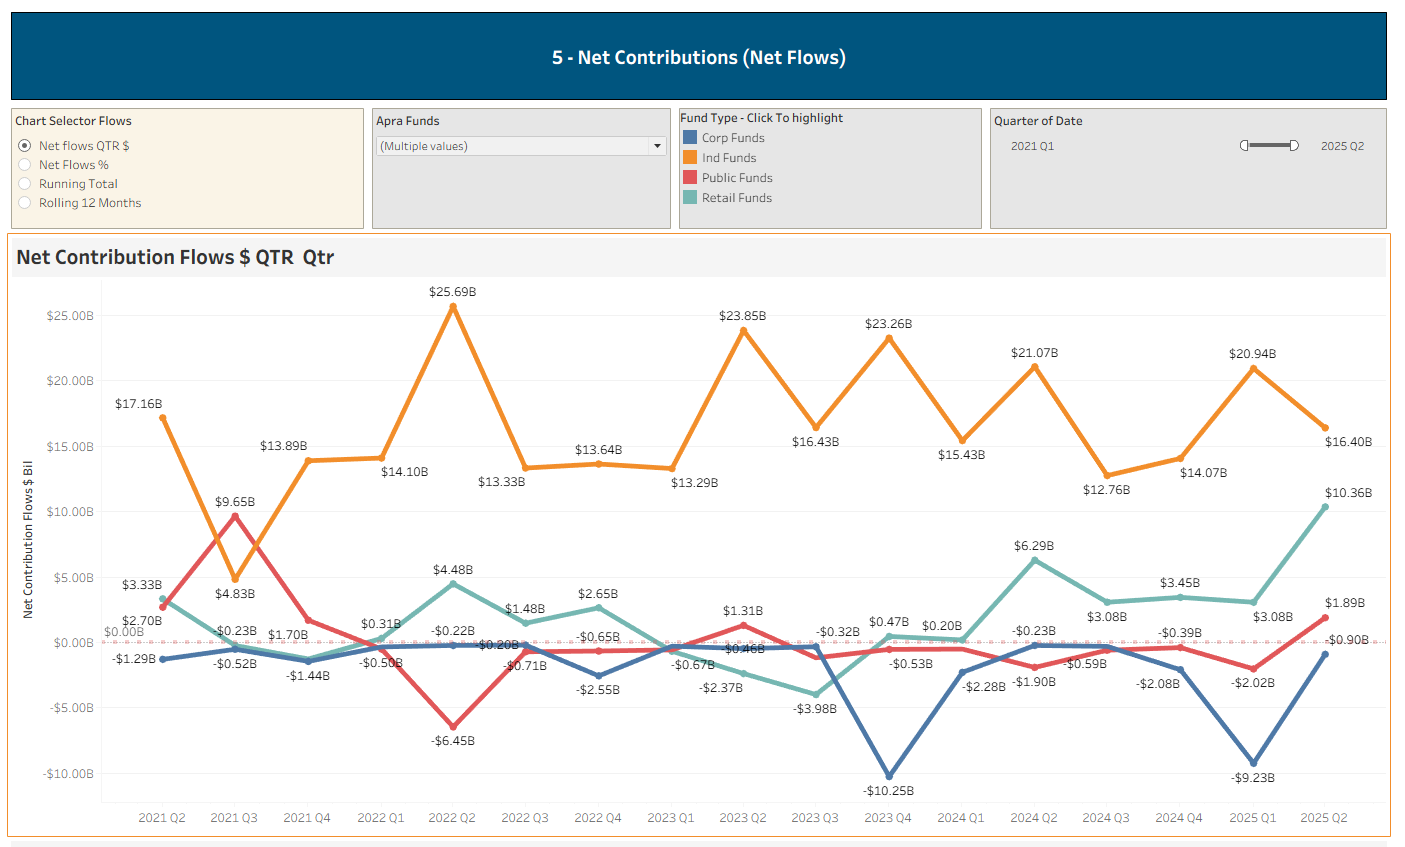
Net Contributions By Quarter Since Q2 2022.
You may also wish to see our detailed analysis of SMSF Funds, which also includes an overlay of Advisers